A couple of days ago I replaced the dashboard for Gentoo Build Publisher. The previous dashboard was basically just a table listing each machine along with the latest build and published build for the respective machine. Typically I use the command-line interface for interacting with GBP, so I hadn't put a lot of attention to the dashboard. But since the dashboard is often seen as the "face" of a project, I decided to spend a bit of time giving it a "facelift". This article aims to explore the features of the new dashboard.
The dashboard is a basic Bootstrap layout. It has four rows displaying a various metadata.
Grand Totals

The first row of the dashboard shows three numbers that give a grand total for the GBP instance at large. Builds shows the total number of builds that the GBP instance holds. So if you have 6 machines each with 6 builds then that would be 6 x 6 = 36 builds. Machines displays the total number of machines that GBP hosts builds for. Finally, Packages displays the grand total of binary packages that GBP hosts. So again if there were 6 machines each having 6 builds and every build had 6 packages then that would be 6 x 6 x 6 = 216 packages. Some machines may have more builds than others and of course each machine may have a different number of packages installed, so my examples are not really true-to-life. The above image though is a true to my personal GBP instance.
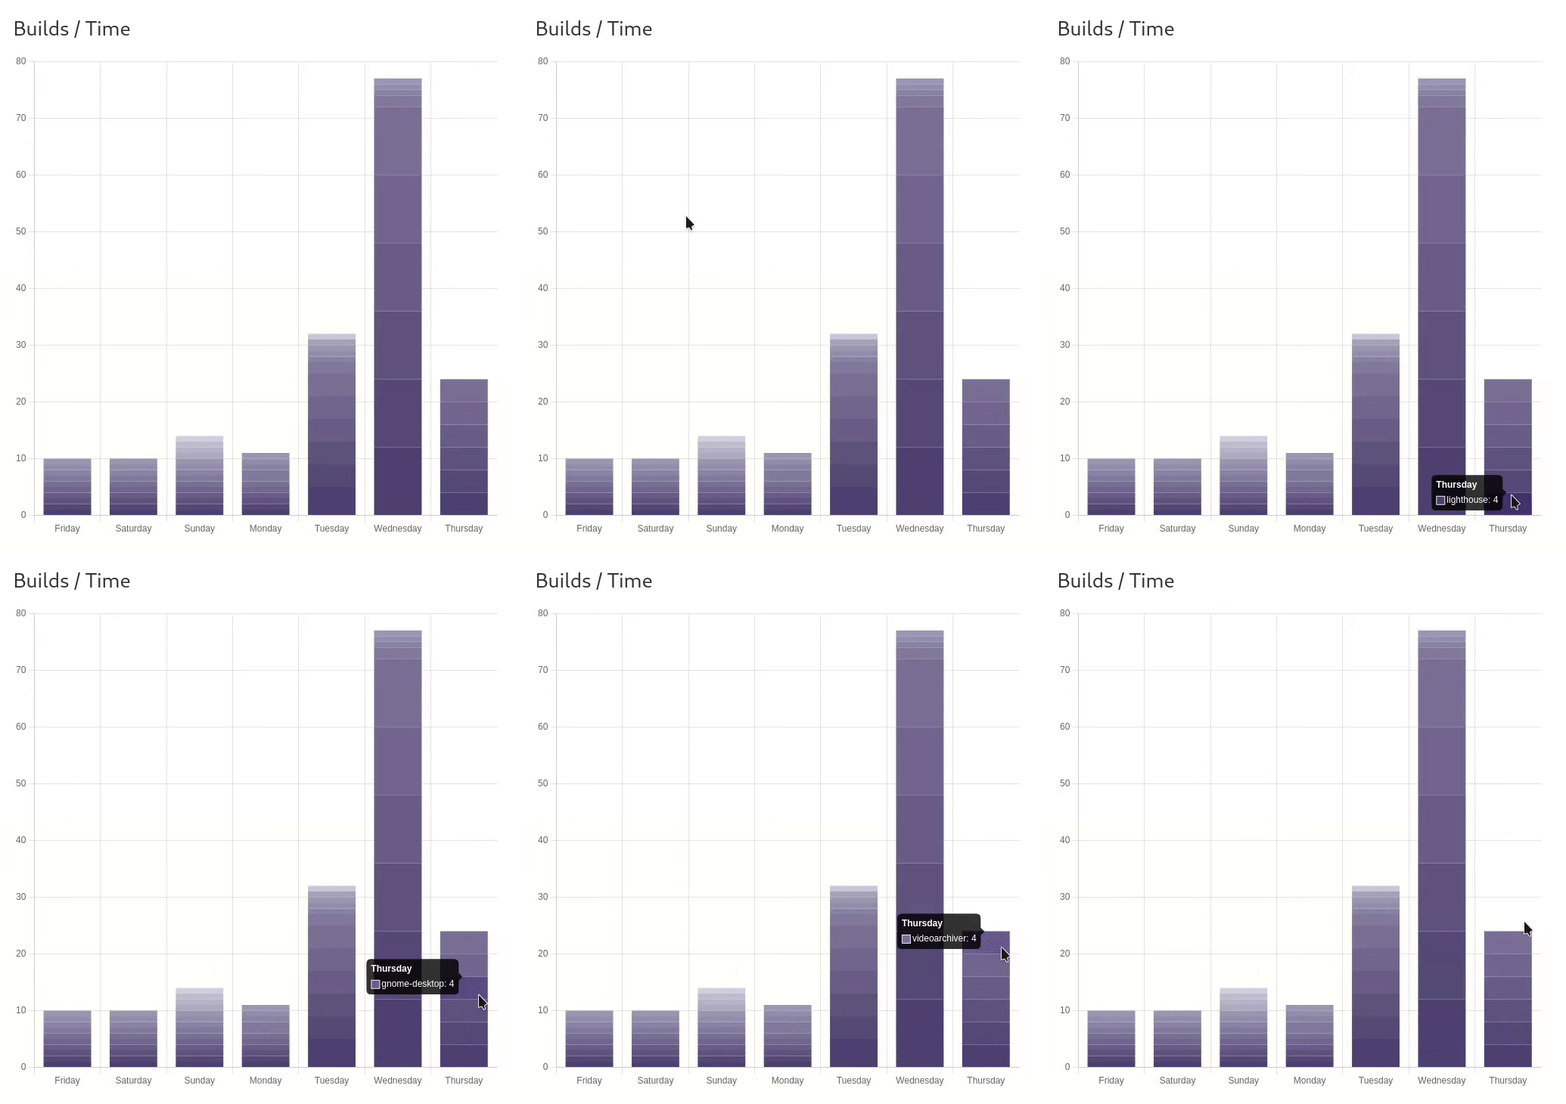
Gentoo Build Publisher has an auto-purge runner on by default, so the number of builds and packages will likely rise throughout the day and then fall after older builds get purged. This depends on the number of machines being built as well as the frequency each machine is being built. On my instance I typically get about 77 builds per day between the 17 machines I have.
Build Charts
The second row of the dashboard shows a couple of charts summarizing builds.

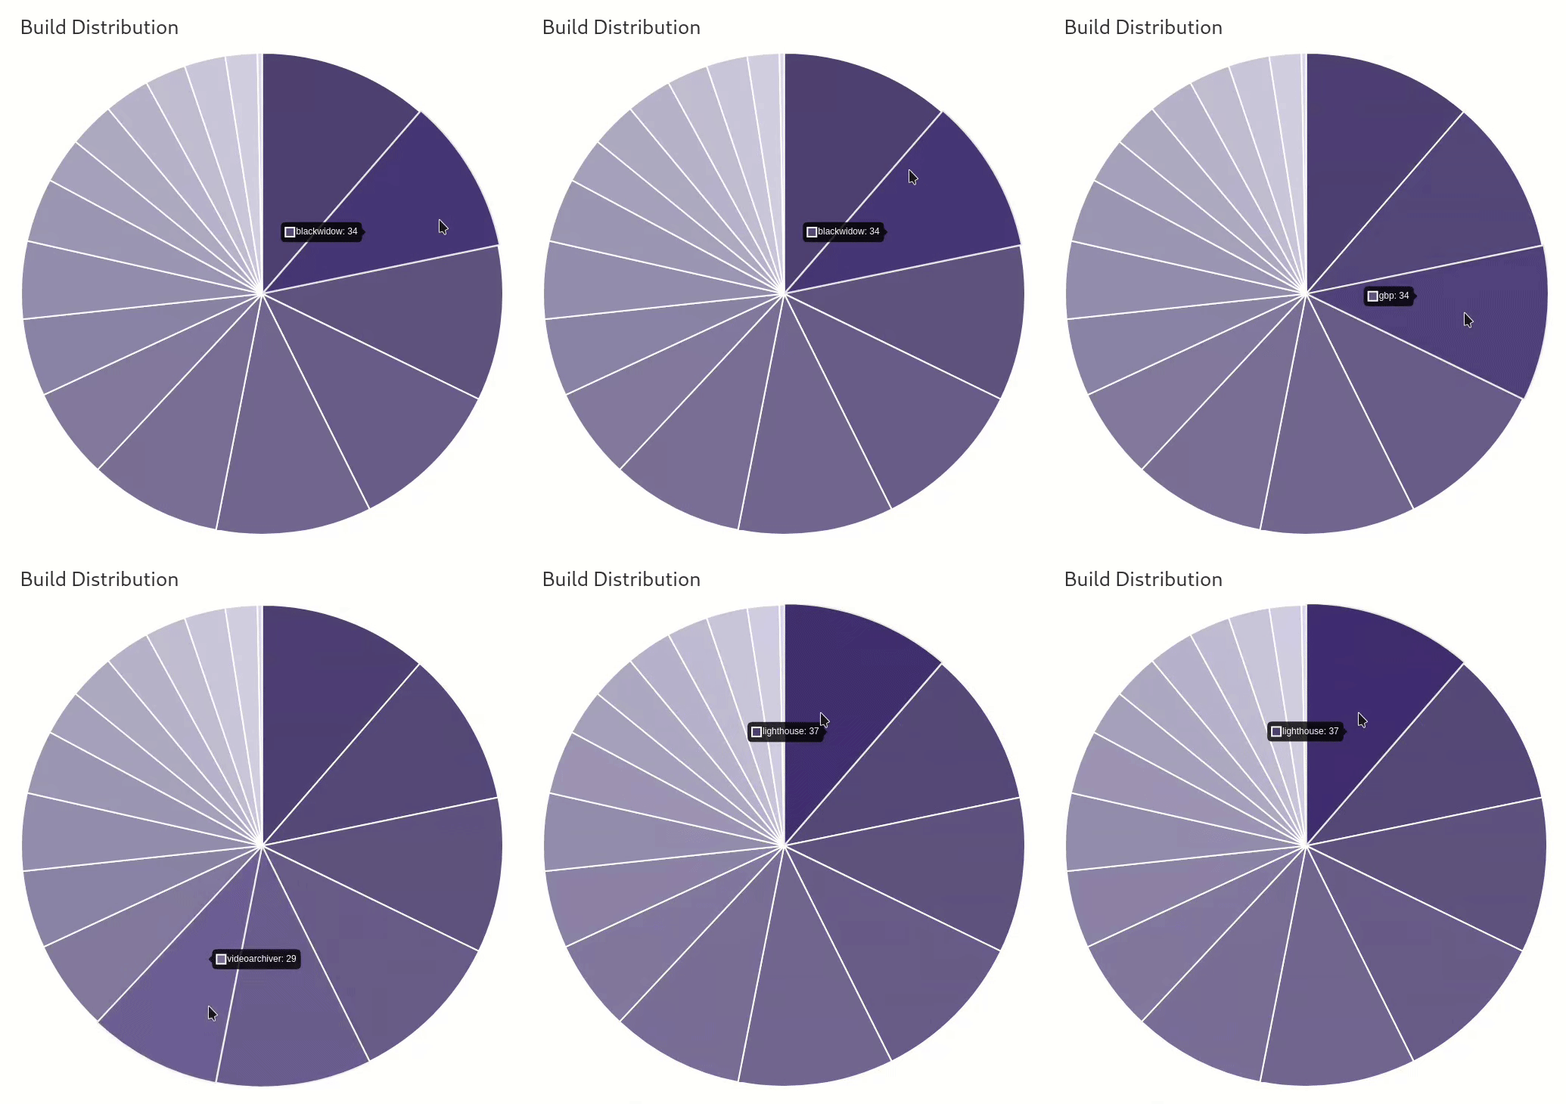
The first chart is the Build Distribution. It is a pie chart showing the distribution of all builds by machine. This can be used to see which machines are producing the most builds. On my instance, some machines build multiple times per day while others are built only once per day or even once per week. And one of my machines gets built manually.

The next chart shows the builds over time for the past week. This number typically grows by the day for the current day while the number drops in previous days due to the auto-purger. It keeps all the builds for the past couple of days, then one per day (for each machine) for a week, then one per week for the month, then one per month for the year, then one per year after that, though the chart only shows the recent week. The chart is stacked so you can see how many builds each machine has each day.
Latest Builds
The third row of the dashboard displays information about the state of the most recent builds for each package.

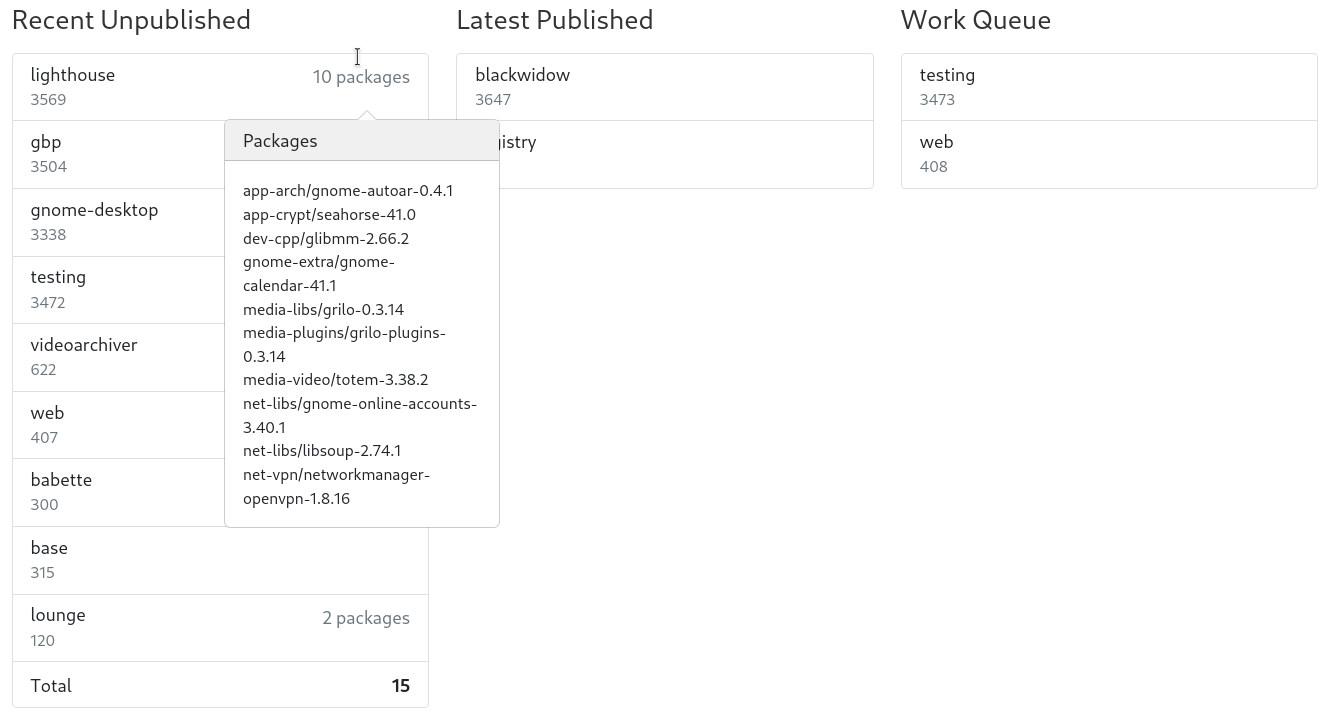
The first column shows Recent Unpublished builds. A machine has the concept of a "latest" build, which is the most recently pulled build for that machine. Furthermore every given build is either "published" or "unpublished". Published means that if you do an emerge --sync and update for a given machine then you will get that build's ebuilds, binary packages, etc. Only one build per machine can be published at a time and you are not required to publish the latest build. Therefore this column shows the latest builds for each machine that have not been published. If a given build has built any packages then the number of packages is also displayed and hovering over it will show the packages built. It only lists the latest builds from the past 24 hours, but a total of the "recent unpublished" builds is displayed at the bottom.
The next column displays Latest Published. These are the kinda the opposite of the previous columns. They are the latest builds for a machine that have are published. Like the previous column, this one also displays the number of packages built in the respective build and hovering over it will list those packages.
Finally the last column in this row displays the Work Queue these are builds that have been requested to pull from Jenkins but have not been completely pulled and extracted. If there is nothing to do then it displays "Nothing to do!". Note for you Celery folks: this is not the of tasks in the Celery queue, but the number tasks that have been (pre)fetched from the Celery queue.
Together, the sum of builds in the three columns in this row should add up to the total number of machines. So in the screenshot above there are 15 recent unpublished builds, 2 latest published and 2 queued: 15 + 2 + 2 = 17 machines.
Miscellaneous

The last row contains a couple of unrelated items.
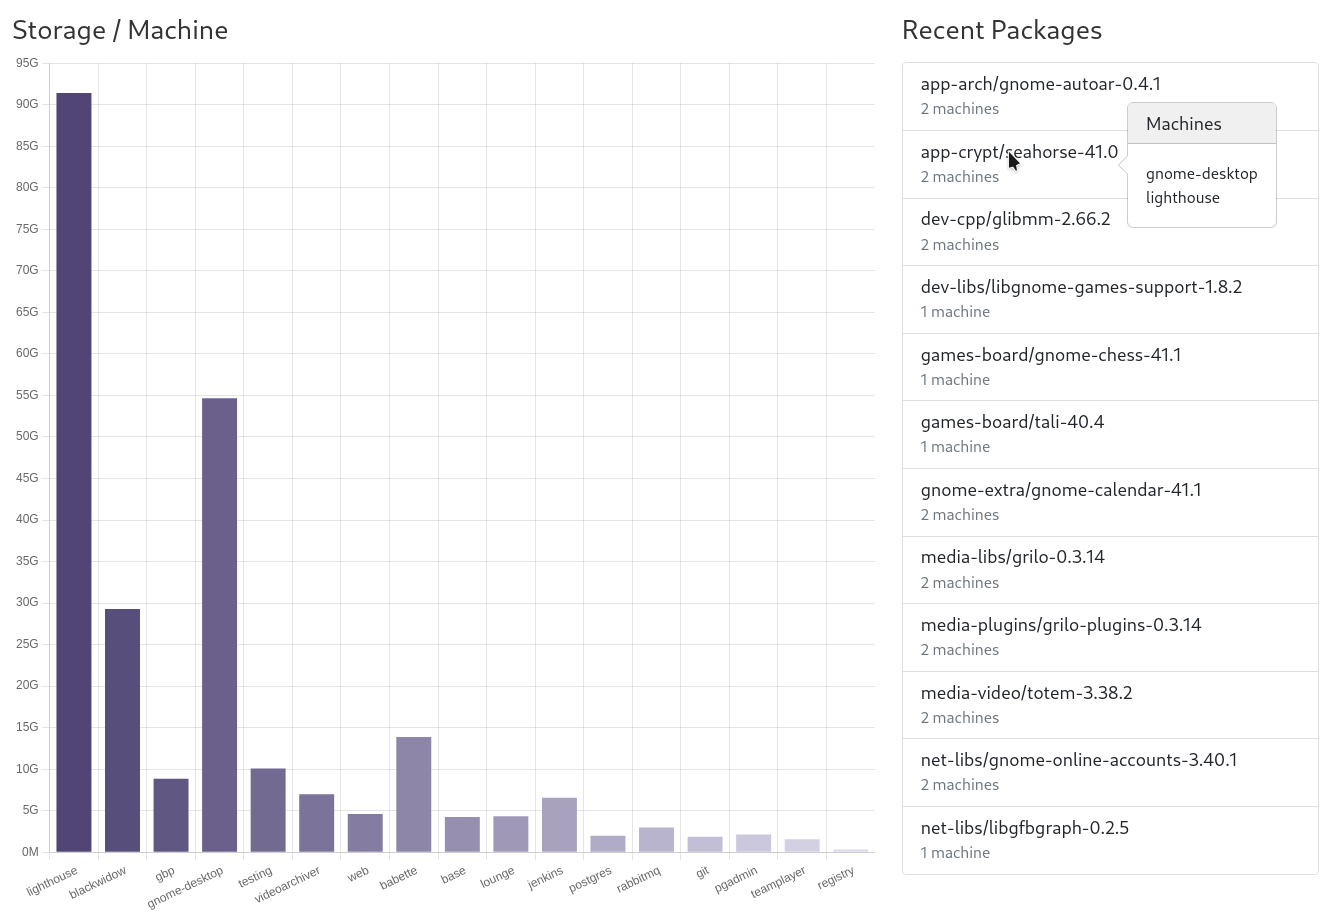
The first column is a graph displaying package storage by machine. It's a bar chart that displays the total size of all the packages of all the builds for each machine. The more packages you have installed for a machine, and the more frequent the machine is built, the more package storage it will have. However these numbers are a bit misleading in that they are not the amount of storage being taken up by packages on Gentoo Build Publisher. For one, these are the sizes of the packages installed, where as the binpackages themselves are compressed archives. Furthermore, since most packages between builds on a given machine are unlikely to change, Gentoo Build Publisher uses hard links for identical packages on a given machine's builds. For example in the chart above, the machine "lighthouse" shows more than 95G of package storage. On the GBP instance, however, that amount of storage for packages is a lot smaller (around 16G).
The next column displays the most recent packages built (among all the machines). It displays the package cpv and the number of machines that recently built that package. Hovering over will show the machine names. To save screen space, only the most recent 12 packages within the past 24 hours are displayed.
Comments/Ideas
Well that's a rundown of the Gentoo Build Publisher dashboard. I am considering adding more pages so you can drill down to a particular machine or a specific build. If you have any comments or ideas for the Gentoo Build Publisher dashboard, feel free to let me know on the GitHub issues page.